Ir al contenido
algo3X
Tradingview Streamline Icon: https://streamlinehq.com
TradingView
Home
Estrategias
Métricas
Recursos
Suscripciones
Contacto
X
Suscribite
Métricas del algoritmo
Suscribite ya
Galac I - TQQQ
Time Range
P&L USD
% Profit
Ratio Sharpe / Sortino
Profit Factor
Total Trades
Profitable Trades
Max Equity drawdowns
Margin Call
Buy & Hold
%Profit
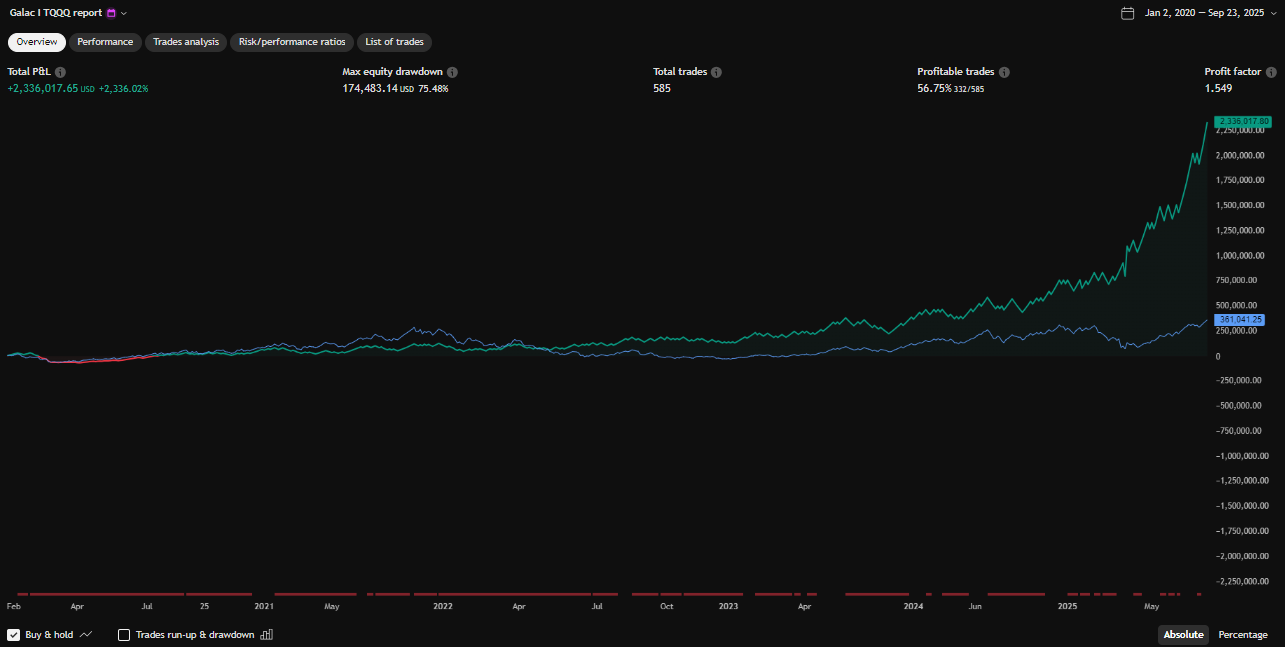
2020-2025
2.336.017,65
2336,02%
0,366/0,603
1,549
585
56,75%
174.483,14 USD (75,48%)
–
356.988,10 USD
356,99%
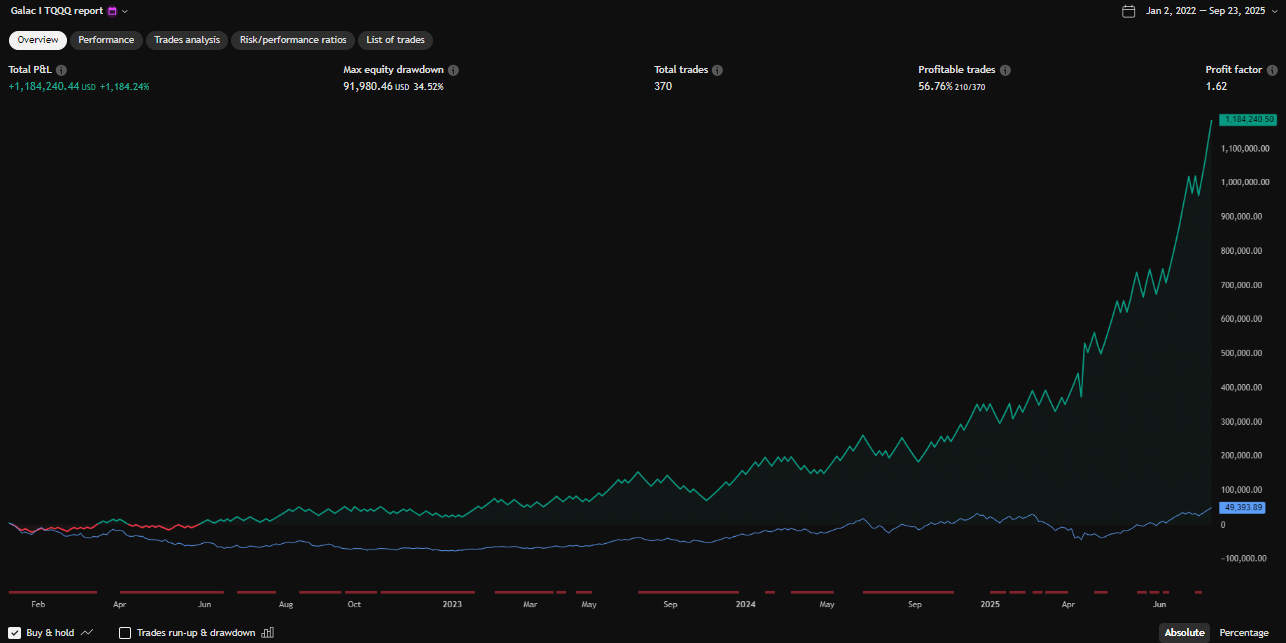
2022-2025
1.182,719,92
1184,12%
0,462/1,072
1,62
370
56,76%
91.980,46 USD (34,52%)
–
48.080,76 USD
114,99%
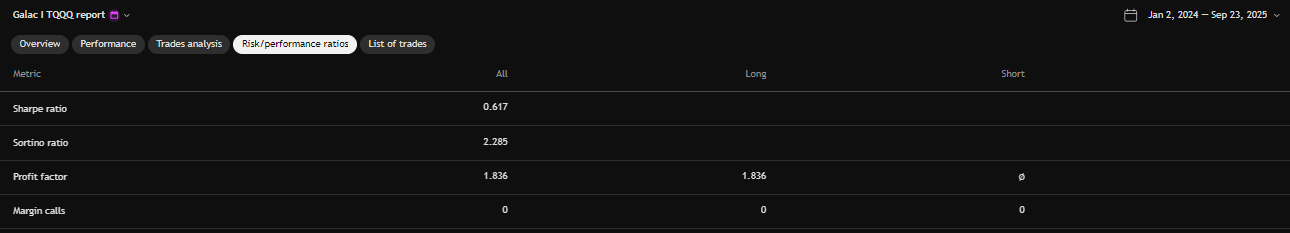
2024-2025
396.591,64
397,02%
0,616/2,283
1,836
144
61,11%
35.603,88 USD (22,96%)
–
114.994,55 USD
114,99%
Galac II - SPXL
Time Range
P&L USD
% Profit
Ratio Sharpe / Sortino
Profit Factor
Total Trades
Profitable Trades
Max Equity drawdowns
Margin Call
Buy & Hold
%Profit
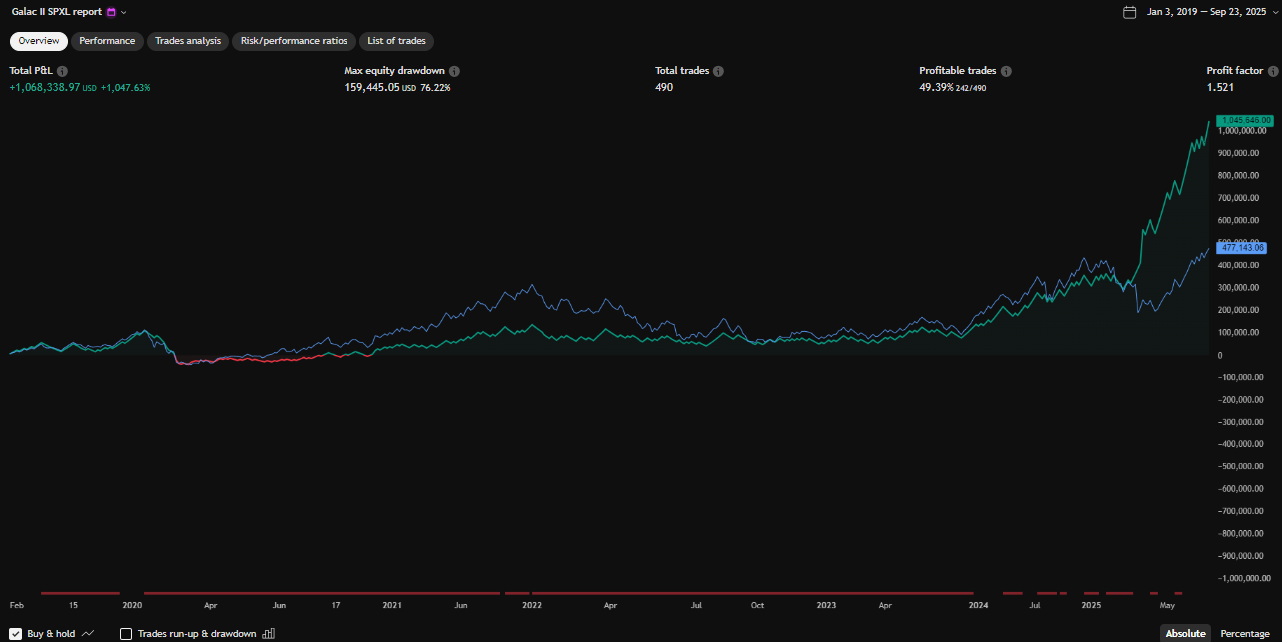
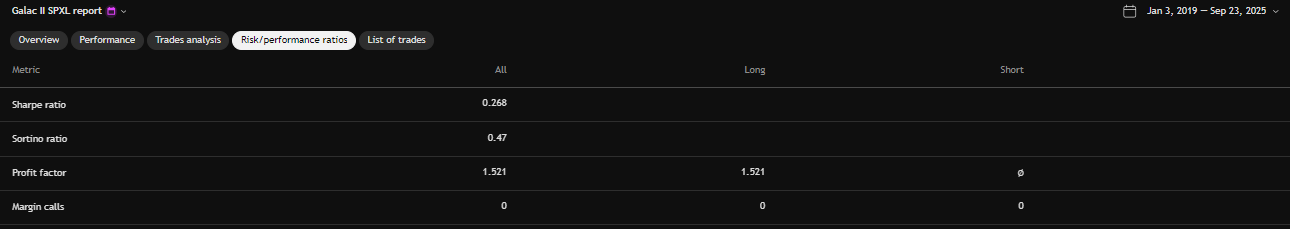
2019-2025
1.068.154,85
1047,45%
0,267/0,469
1,521
490
49,39%
159.419,92 USD (76,22%)
–
496.525,82 USD
496,53%
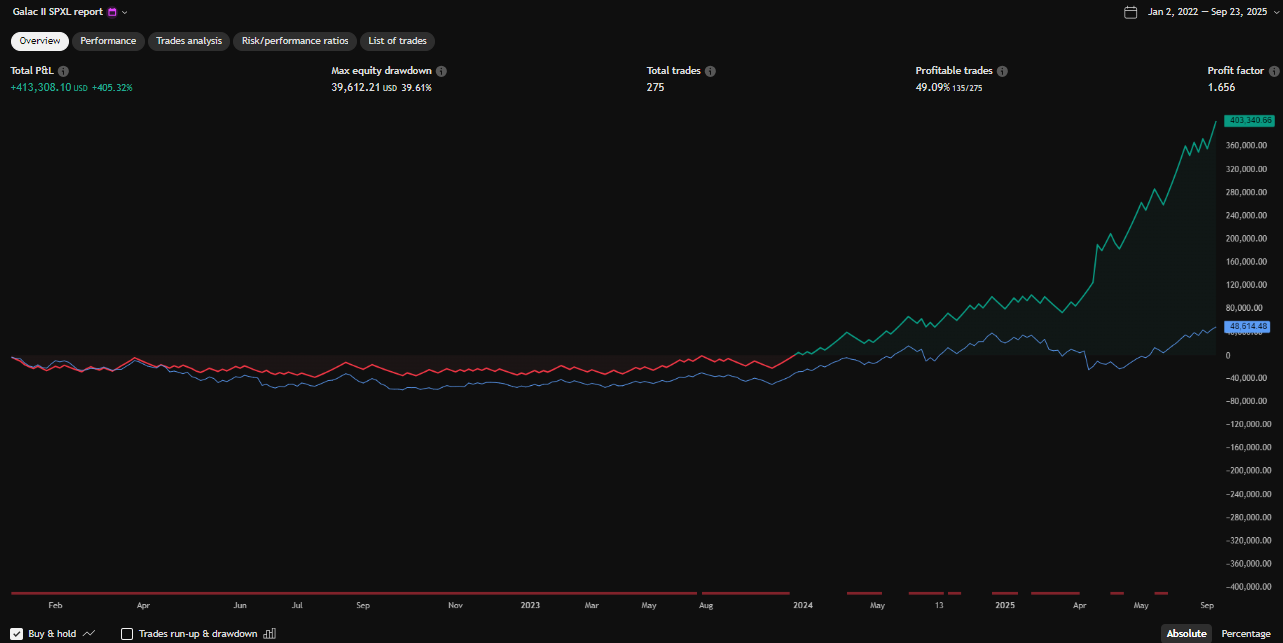
2022-2025
413.308,10
405,32%
0,285/0,699
1,656
275
49,09%
39.612,21 USD (39,61%)
–
52.627,53 USD
52,62%
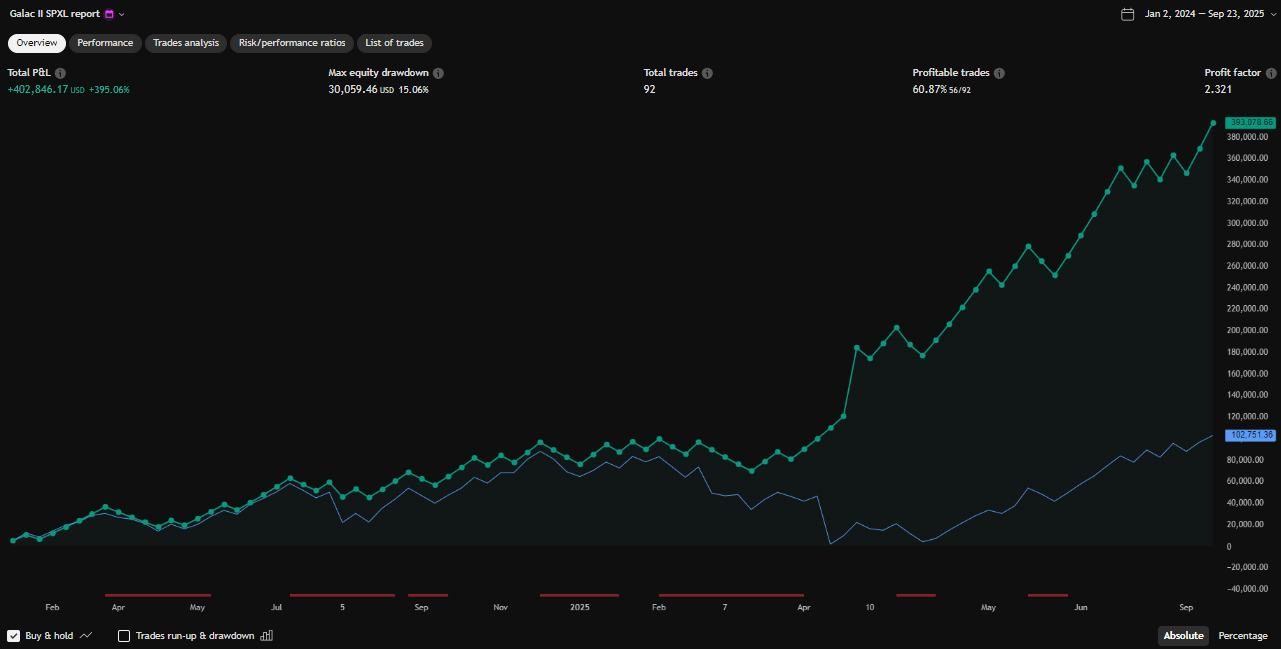
2024-2025
402.843,17
395,06%
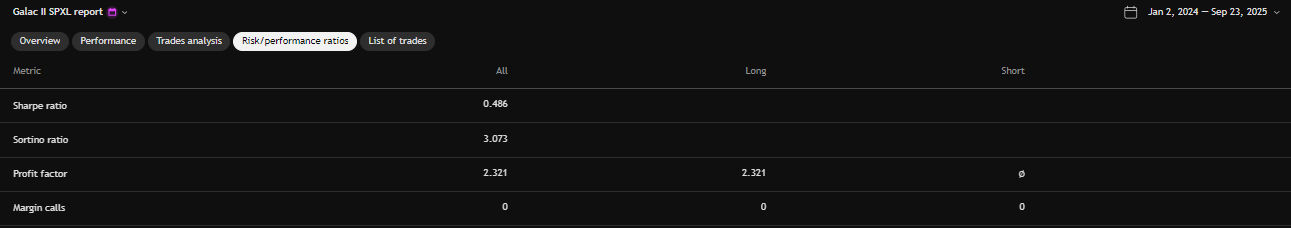
0,486/3,073
2,321
92
60,87%
30.059,46 USD (15,06%)
–
108.227,2 USD
108,23%
Galac III - SOXL
Time Range
P&L USD
% Profit
Ratio Sharpe / Sortino
Profit Factor
Total Trades
Profitable Trades
Max Equity drawdowns
Margin Call
Buy & Hold
%Profit
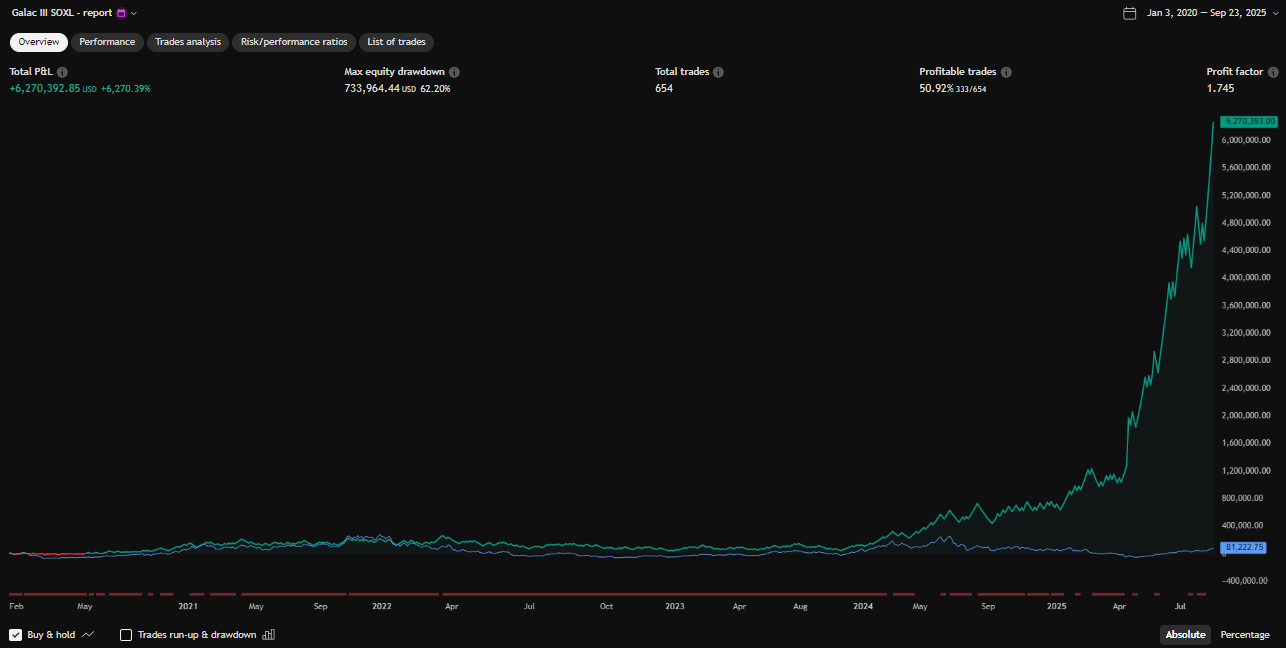
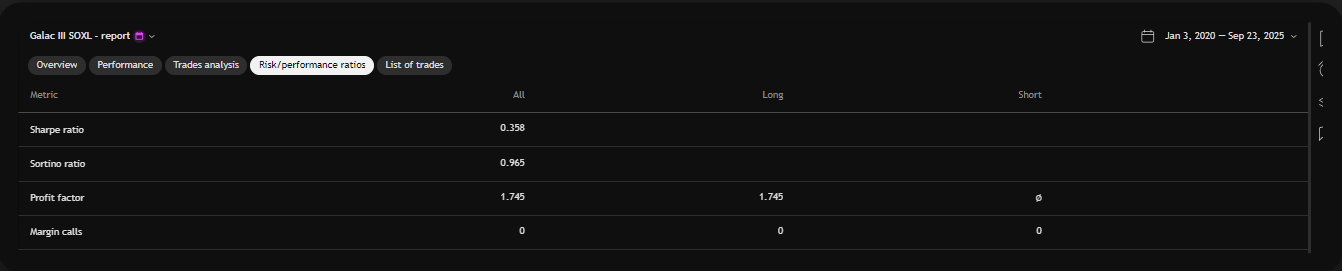
2020-2025
6.270.392,85
6.270,39%
0,358/0,965
1,745
654
50,92%
733.964,44 USD (62,20%)
–
77.045,58 USD
77,05%
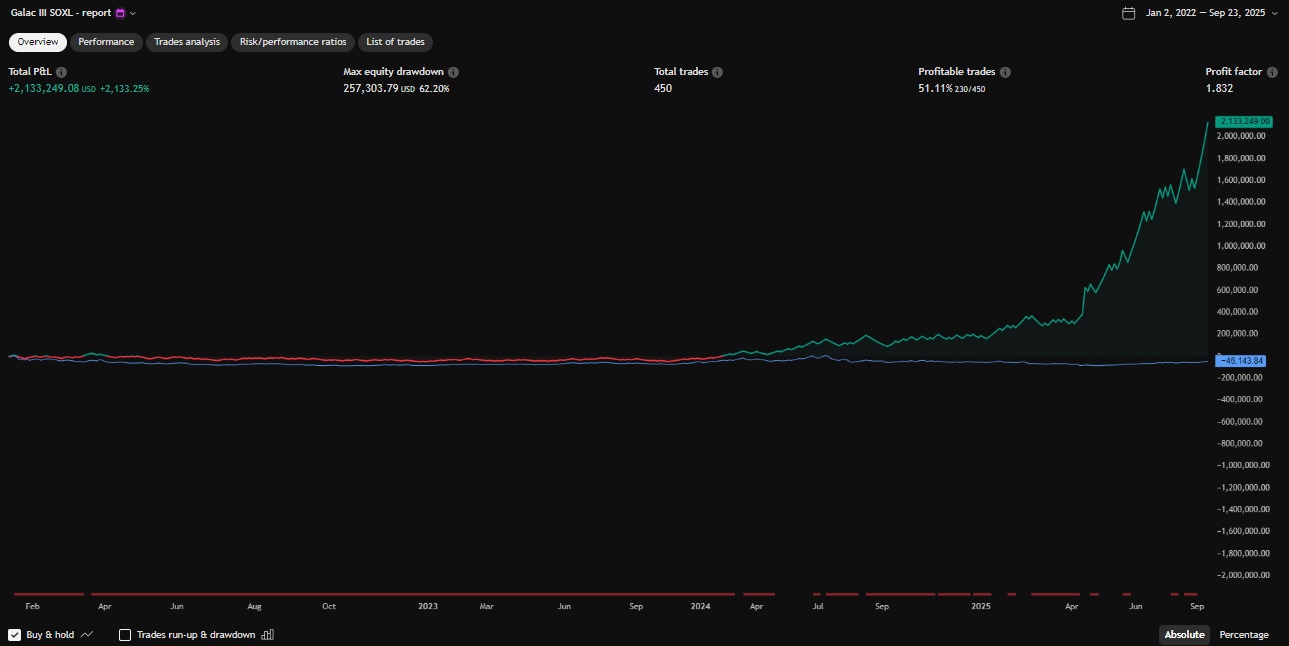
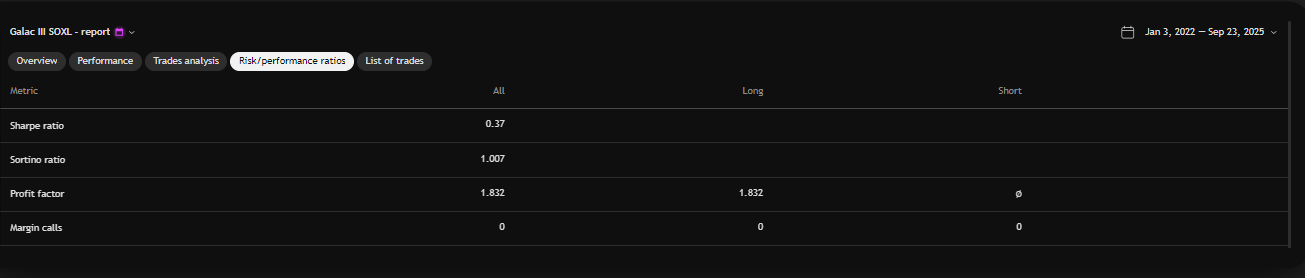
2022-2025
2.133.249,08
2133,25%
0,37/1,007
1,832
450
51,11%
257.303,79 USD (62,20%)
–
-47.384,76 USD
-47,38%
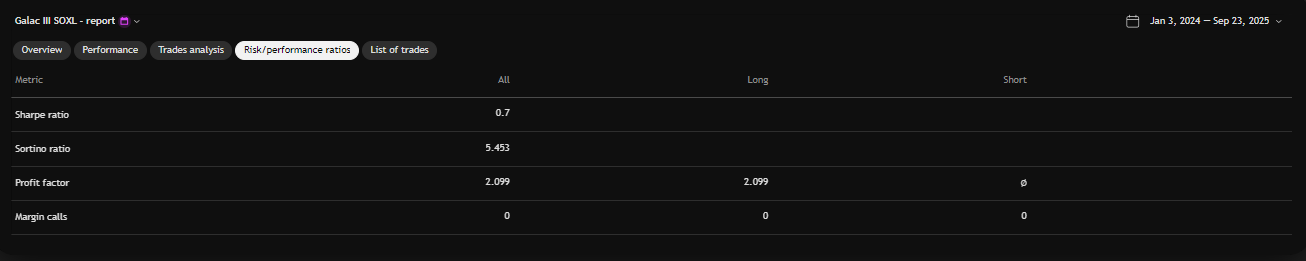
2024-2025
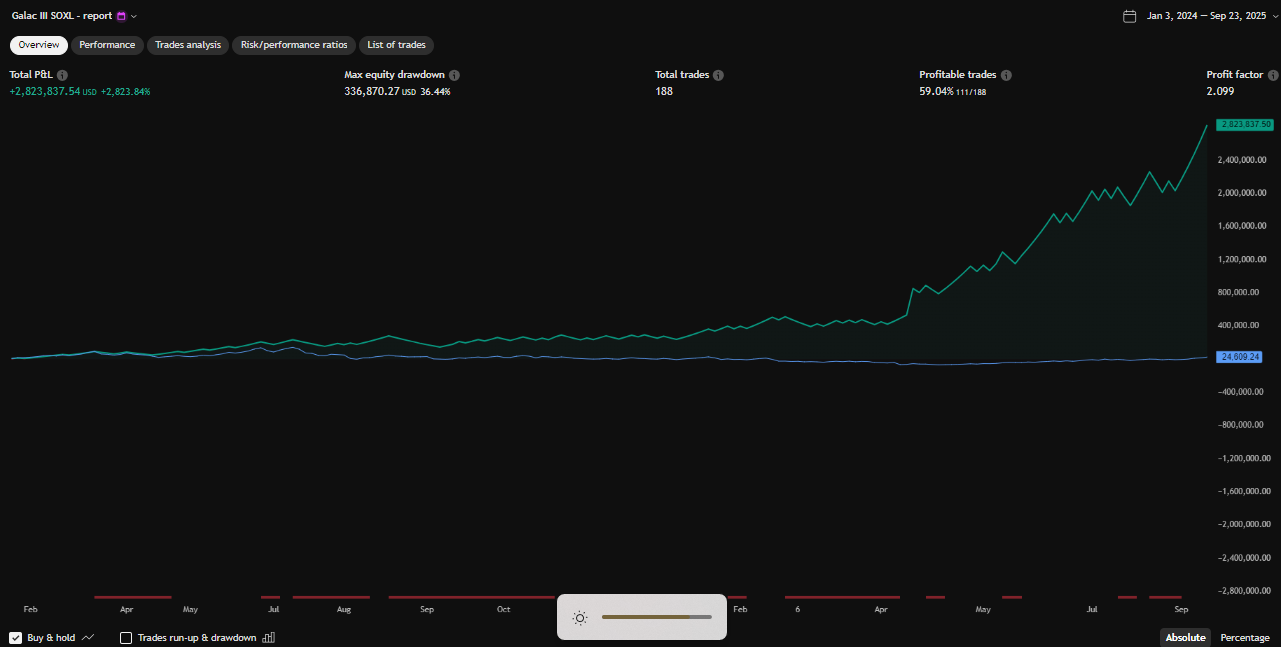
2.823.837,54
2823,84%
0,7/5,453
2,099
188
59,04%
336.870,27 USD (36,44%)
–
21.753,98 USD
21,74%
Galac Pro - SOXL
Time Range
P&L USD
% Profit
Ratio Sharpe / Sortino
Profit Factor
Total Trades
Profitable Trades
Max Equity drawdowns
Margin Call
Buy & Hold
%Profit
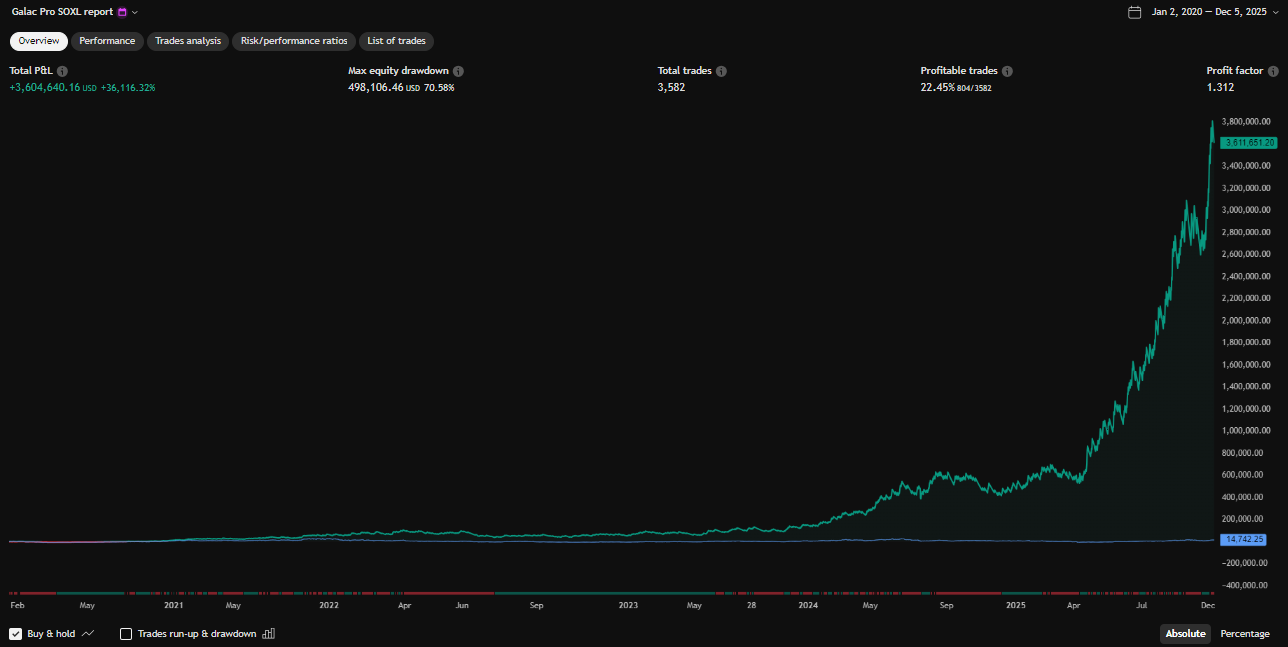
2020-2025
3,604,640.16
36116.32%
0,50/0,99
1,312
3582
22,45%
498.106,46 USD
–
15.088,49 USD
150,88%
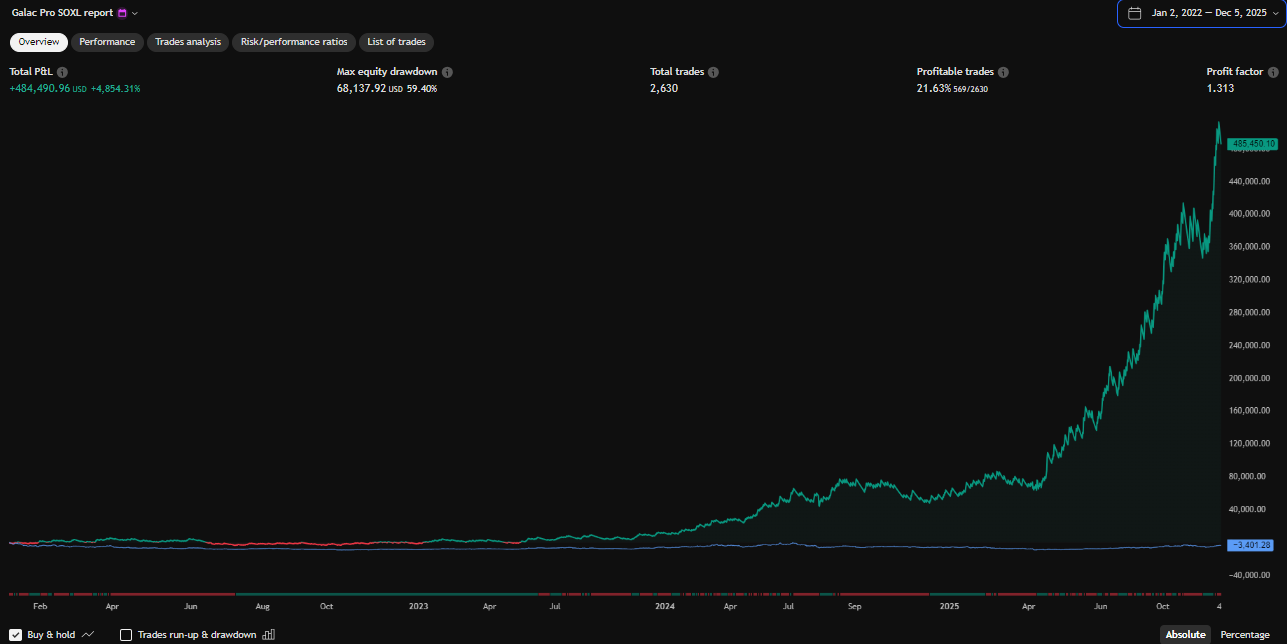
2022-2025
484.490,96
4854,31%
0,49/1,023
1,313
2630
21,63%
68.137,92 USD
–
-3.303,12 USD
-33,09%
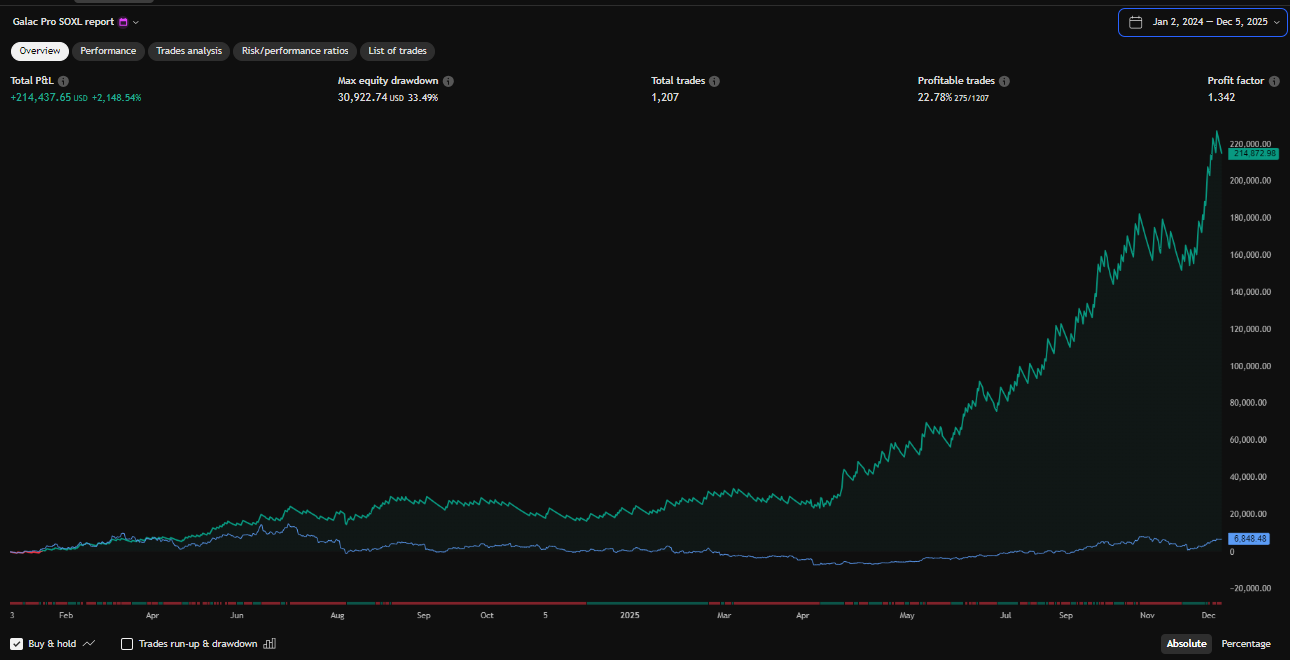
2024-2025
214.437,65
2148,54%
0,816/3,19
1,342
1207
22,78%
30992,74 USD
–
7.084,00 USD
70,84%
Reporte
Galac I
P&L Galac I 2020-2025
P&L Galac I 2020-2025
P&L Galac I 2022-2025
P&L Galac I 2022-2025
P&L Galac I 2024-2025
P&L Galac I 2024-2025
Ratio Galac I 2020-2025
Ratio Galac I 2020-2025
Ratio Galac I 2022-2025
Ratio Galac I 2022-2025
Ratio Galac I 2024-2025
Ratio Galac I 2024-2025
Reporte
Galac II
P&L Galac II 2019-2025
P&L Galac II 2019-2025
P&L Galac II 2022-2025
P&L Galac II 2022-2025
P&L Galac II 2024-2025
P&L Galac II 2024-2025
Ratio Galac II 2019-2025
Ratio Galac II 2019-2025
Ratio Galac II 2022-2025
Ratio Galac II 2022-2025
Ratio Galac II 2024-2025
Ratio Galac II 2024-2025
Reporte
Galac III
P&L Galac III 2020-2025
P&L Galac III 2020-2025
P&L Galac III 2022-2025
P&L Galac III 2022-2025
P&L Galac III 2024-2025
P&L Galac III 2024-2025
Ratio Galac III 2020-2025
Ratio Galac III 2020-2025
Ratio Galac III 2022-2025
Ratio Galac III 2022-2025
Ratio Galac III 2024-2025
Ratio Galac III 2024-2025
Reporte
Galac Pro
P&L Galac Pro 2020-2025
P&L Galac Pro 2020-2025
P&L Galac Pro 2022-2025
P&L Galac Pro 2022-2025
P&L Galac Pro 2024-2025
P&L Galac Pro 2024-2025
Ratio Galac Pro 2020-2025
Ratio Galac Pro 2020-2025
Ratio Galac Pro 2022-2025
Ratio Galac Pro 2022-2025
Ratio Galac Pro 2024-2025
Ratio Galac Pro 2024-2025